Supervised machine learning · UCLA → IPMLP 2025
Wine Quality
Prediction with Ensemble Trees
Comparing predictive quality, feature count, and the cost of model selection.
My Contribution
End-to-end ML pipeline
Independently designed and implemented the complete machine-learning and evaluation pipeline.
Controlled experiments
Conducted preprocessing, model tuning, feature-selection ablations, compute profiling, result analysis, and visualization.
Research communication
Expanded the UCLA course project into a sole-authored conference paper and independently wrote the manuscript under Prof. Chunyang Liao.
One protocol, five model families
This project began as a UCLA Summer Sessions course project and was later independently expanded into a sole-authored conference paper. The benchmark compares Random Forest, Gradient Boosting, XGBoost, LightGBM, and CatBoost on 6,497 Vinho Verde samples.
- 01Hold out the test set
80:20 stratified split before model selection.
- 02Preprocess each fold
Scaling, SMOTE-Tomek, and class weights.
- 03Tune & compare
Optuna search within five-fold training CV.
- 04Evaluate trade-offs
Held-out scores, five-feature subsets, and compute cost.
Predictive quality versus search cost
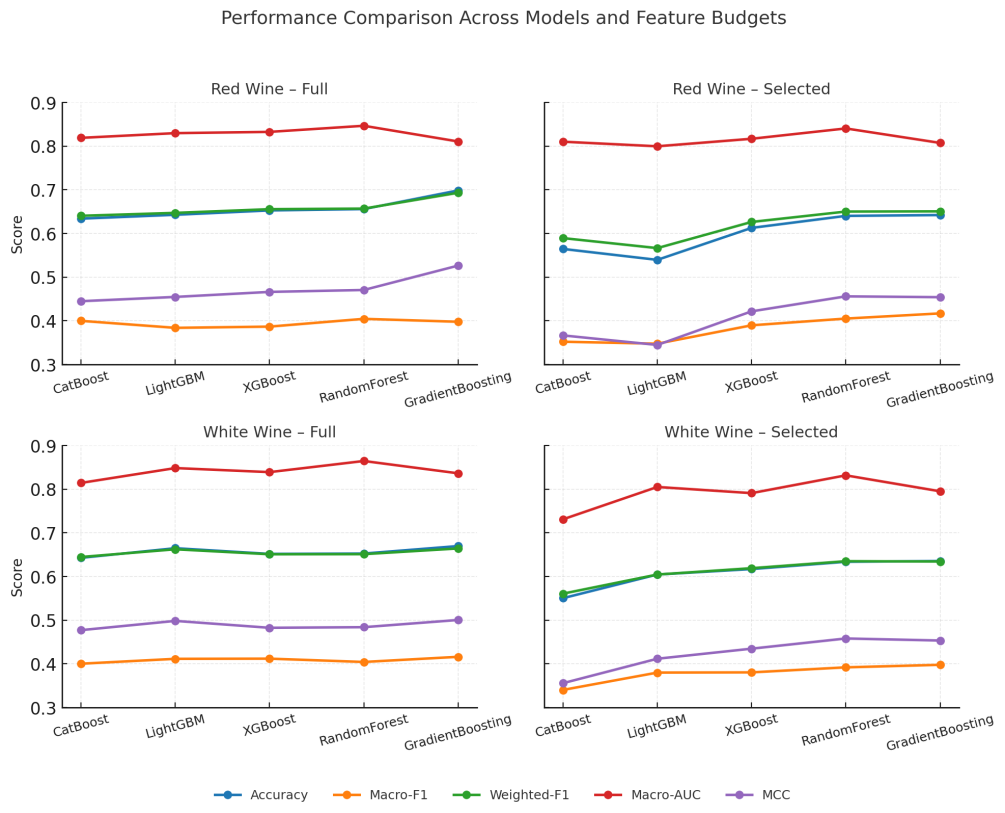
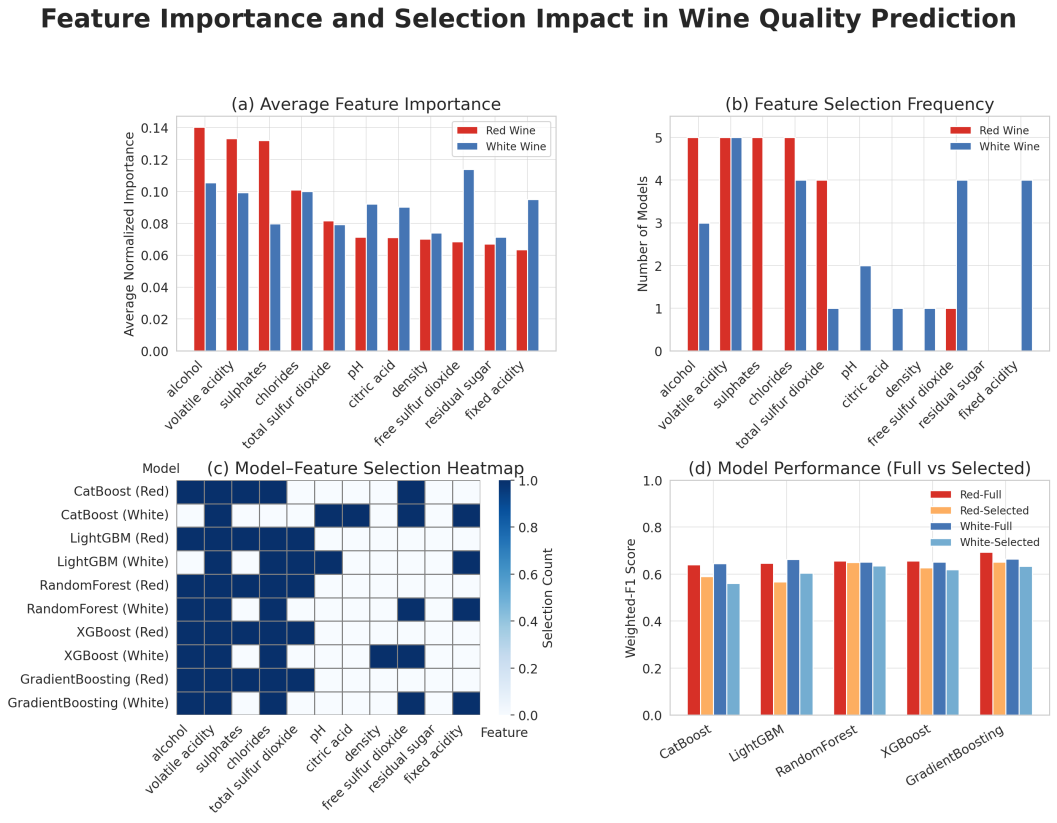
Gradient Boosting produced the highest held-out weighted F1 on both datasets: 0.693 ± 0.028 for red wine and 0.664 ± 0.016 for white wine. When the five model-specific features replaced all 11 inputs, the median weighted F1 decreased by 2.6 percentage points for red wine and 3.0 percentage points for white wine. The ablation therefore quantifies the performance cost of reducing the number of measured variables.
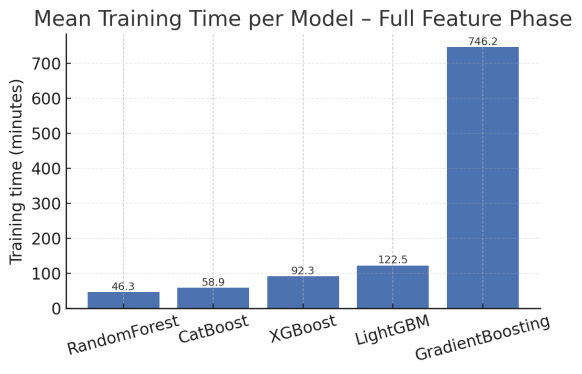
Compute profiling exposed a much larger difference in optimization cost. During the full-feature phase, mean study times were 46.3 minutes for Random Forest, 58.9 minutes for CatBoost, 92.3 minutes for XGBoost, 122.5 minutes for LightGBM, and 746.2 minutes for Gradient Boosting. Within this experimental setup, Random Forest provided the strongest compute-performance compromise, whereas Gradient Boosting defined the best weighted-F1 result at substantially higher search cost.
Scope & reproducibility
- The evaluation uses one public dataset family from the Vinho Verde region of Portugal; performance across other regions, vintages, or laboratory protocols was not established.
- This work is an offline comparative benchmark, not a deployed production or real-time quality-control system.
- The project does not provide a public code repository. The paper documents the evaluation pipeline, search spaces, software versions, and random seeds needed to interpret and reproduce the reported protocol.
- Feature-importance rankings are specific to the evaluated models and datasets and should not be interpreted as causal scientific conclusions.
Leakage-Controlled Evaluation Pipeline
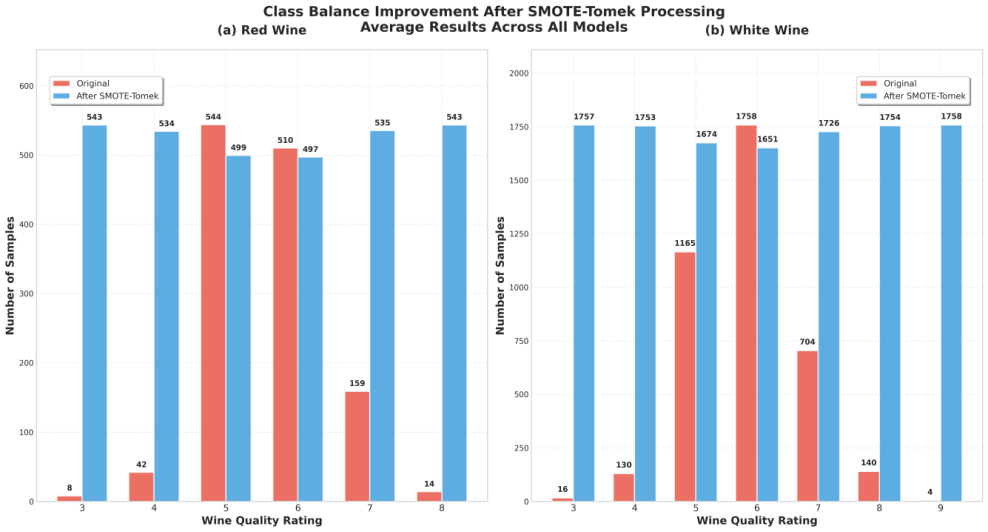
The combined dataset contains 11 continuous physicochemical measurements and an ordinal quality label. Observed ratings span 3–8 for red wine and 3–9 for white wine, with most samples concentrated in the middle classes.
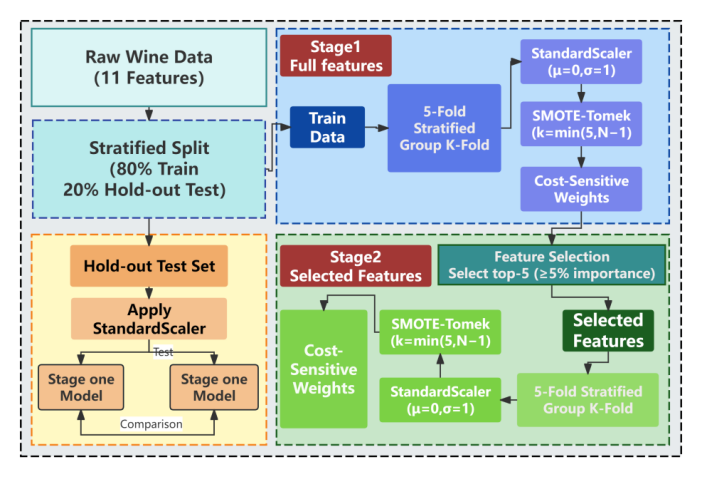
Each dataset was divided using an 80:20 stratified train-test split. Model selection was then performed only within the training partition using five-fold StratifiedGroupKFold. Standardization, SMOTE-Tomek resampling, and inverse-frequency weighting were fitted independently inside each training fold. This design was intended to prevent preprocessing and model-selection information from leaking out of the held-out evaluation protocol.

Model Search and Feature Selection
Optuna's Tree-structured Parzen Estimator tuned each model with a fixed search budget: 200 trials for Random Forest, 120 for Gradient Boosting, 200 for XGBoost, 200 for LightGBM, and 150 for CatBoost. Weighted F1 was the sole hyperparameter-optimization objective. Macro F1, macro ROC-AUC, Matthews correlation coefficient, and Brier score were retained as complementary evaluation measures.
After full-feature tuning, each model ranked features using its native tree-based importance measure. For each model-and-dataset combination, the model was then refitted using its own five highest-ranked features, subject to a 5% minimum importance threshold. The resulting subsets therefore vary by algorithm and dataset; they are predictive rankings within this benchmark rather than a universal or causal list of wine-quality determinants.
Error Analysis
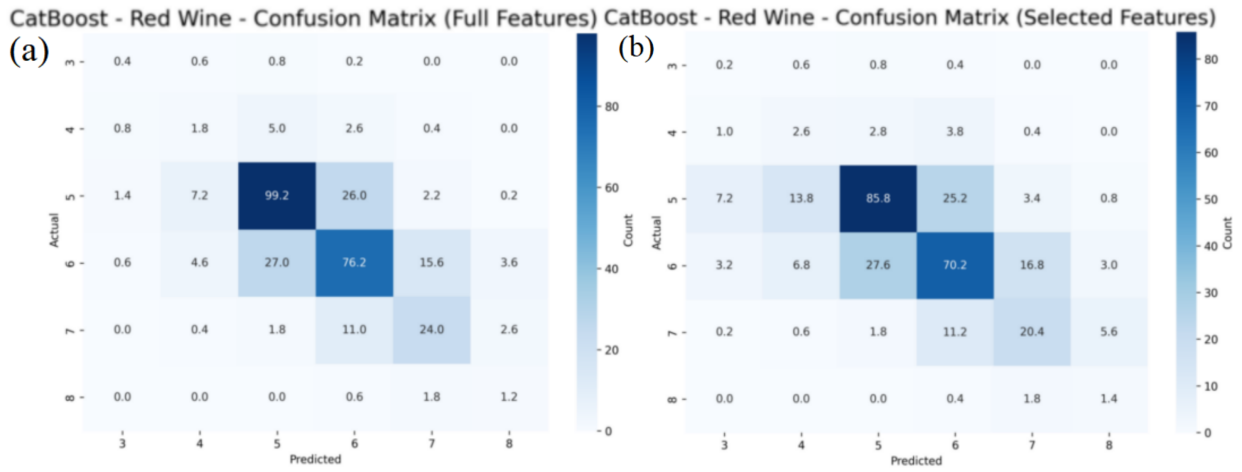
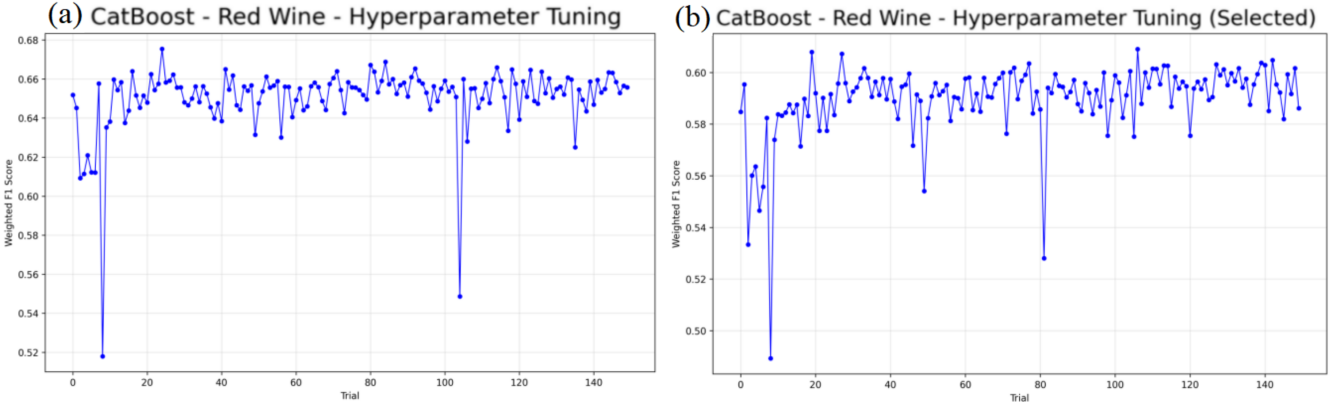
The CatBoost red-wine experiment illustrates two recurring error patterns. Its weighted F1 decreased from 0.6406 with all 11 features to 0.5895 with the selected subset. In both confusion matrices, predictions were concentrated around the common quality scores 5 and 6, while the rarer edge classes remained more difficult to identify.
The accompanying Optuna histories show that the reduced-feature search converged to a lower validation ceiling rather than simply requiring more trials. Together, these results reinforce that the compact subsets should be treated as an efficiency-oriented ablation, not as a lossless replacement for the full measurements.
Project Information
- Duration: June 2024 – August 2024
- Origin: UCLA Summer Sessions course project, later expanded into independent research
- Supervisor: Prof. Chunyang Liao, UCLA
- Tools: Python 3.10, scikit-learn 1.4, XGBoost 2.x, LightGBM 4.x, CatBoost 1.2, Optuna 3.5, Pandas, and NumPy
- Compute Environment: AMD EPYC 9K84, 128 logical cores, 512 GB RAM, and one NVIDIA H20 GPU
Publication
Zilang Chen. “Wine Quality Prediction with Ensemble Trees: A Unified, Leak-Free Comparative Study.” Published at IPMLP 2025; proceedings published by ACM, pp. 162–170.